Our guide to FTC rankings and OPR explained what OPR is and warned that it's noisy. This time we tested that warning against reality — every qualification match of the 2025–2026 Decode season.
The setup
We pulled the full season from the FTC Events API: 38,035 qualification matches across 1,460 events and 8,352 teams, and computed each team's season-long OPR. The scores are the official post-penalty final scores — the same numbers used for rankings, not auto-only or pre-foul subtotals.
What an OPR number actually looks like
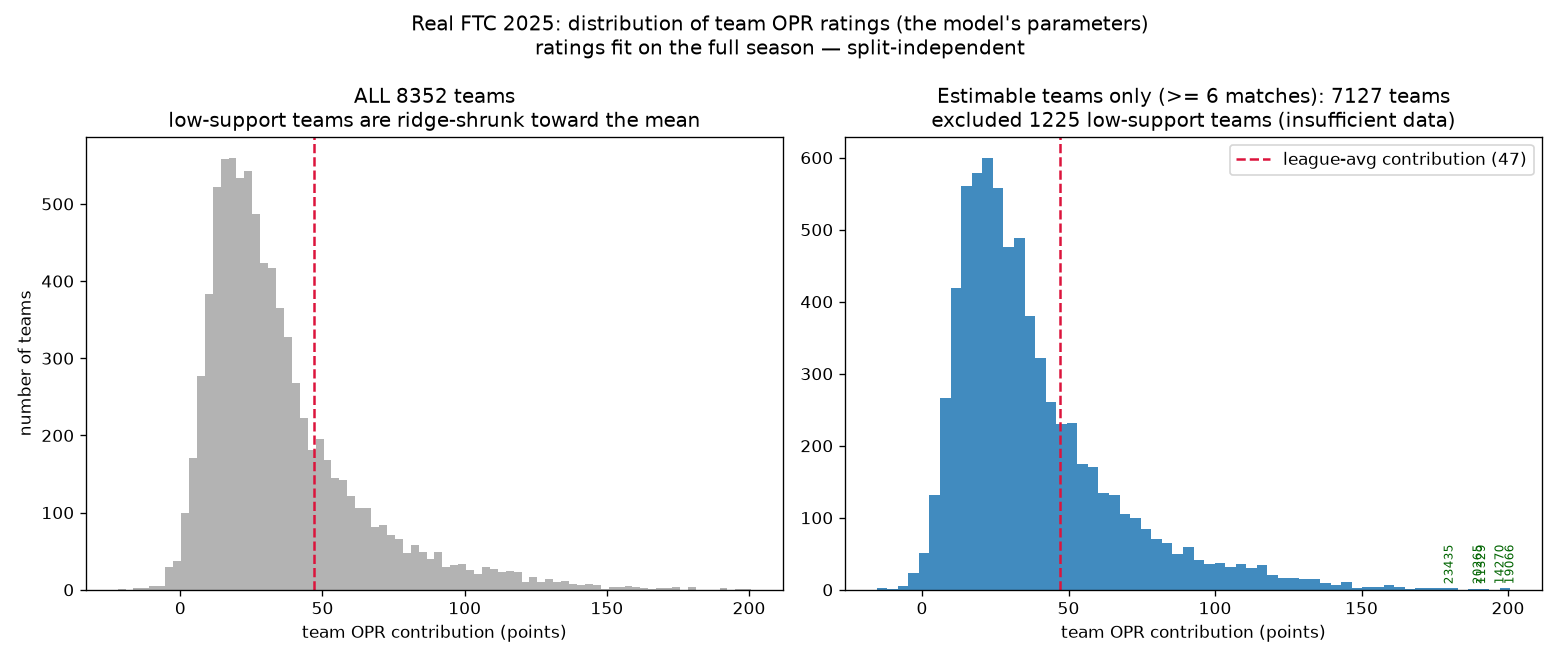
The average team contributes about 47 points; the very best sit near 190–200, with a long tail of strong teams. But there's a catch: 1,225 teams couldn't be reliably rated at all — they played fewer than six matches, so there isn't enough data to separate their contribution from their partners'. Their rating gets pulled toward the average and means little.
As a score predictor, it's rough
Add two teams' OPRs and you get a predicted alliance score. Tested on later matches at the same event, those predictions are off by about 42 points on average — better than the ~52 you'd get by guessing the league average, but still a wide miss.
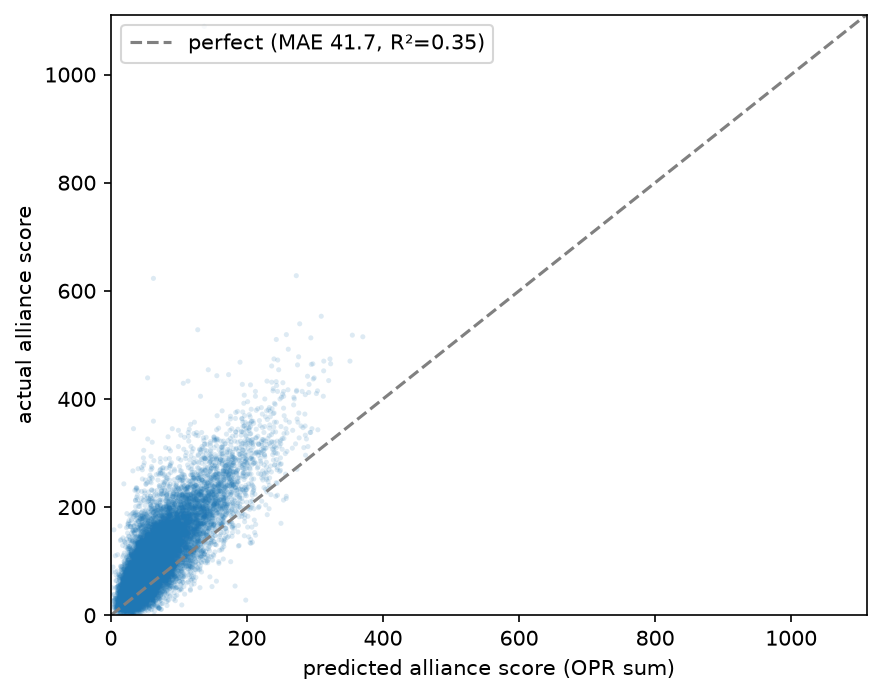
So if a number tells you an alliance "will score 140," treat it as a ballpark, not a fact. That's the small-sample noise from 5–7 matches per team, exactly as expected.
The surprise: win probability is accurate
Here's the twist. OPR is bad at exact scores but good at who beats whom. Turning the OPR gap between two alliances into a win probability, the model calls the winner correctly about 71% of the time (vs. ~49% for guessing). And the probabilities are well-calibrated: when it says "70% red," red really wins about 70% of the time.
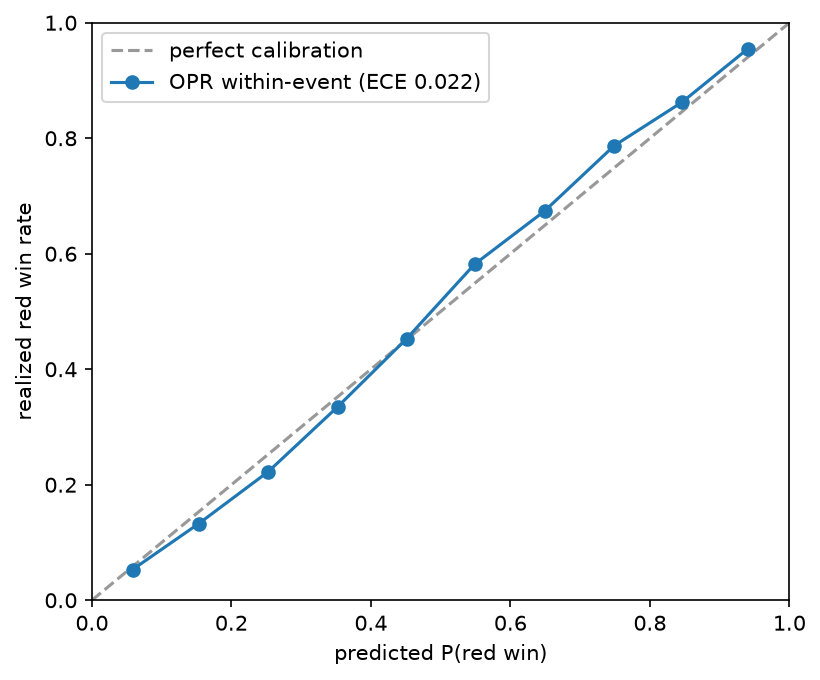
The errors in individual ratings partly cancel when you compare two alliances, so a fuzzy point estimate becomes a trustworthy probability. The takeaway: use OPR for odds, not exact scores.
The season-long catch: OPR drifts
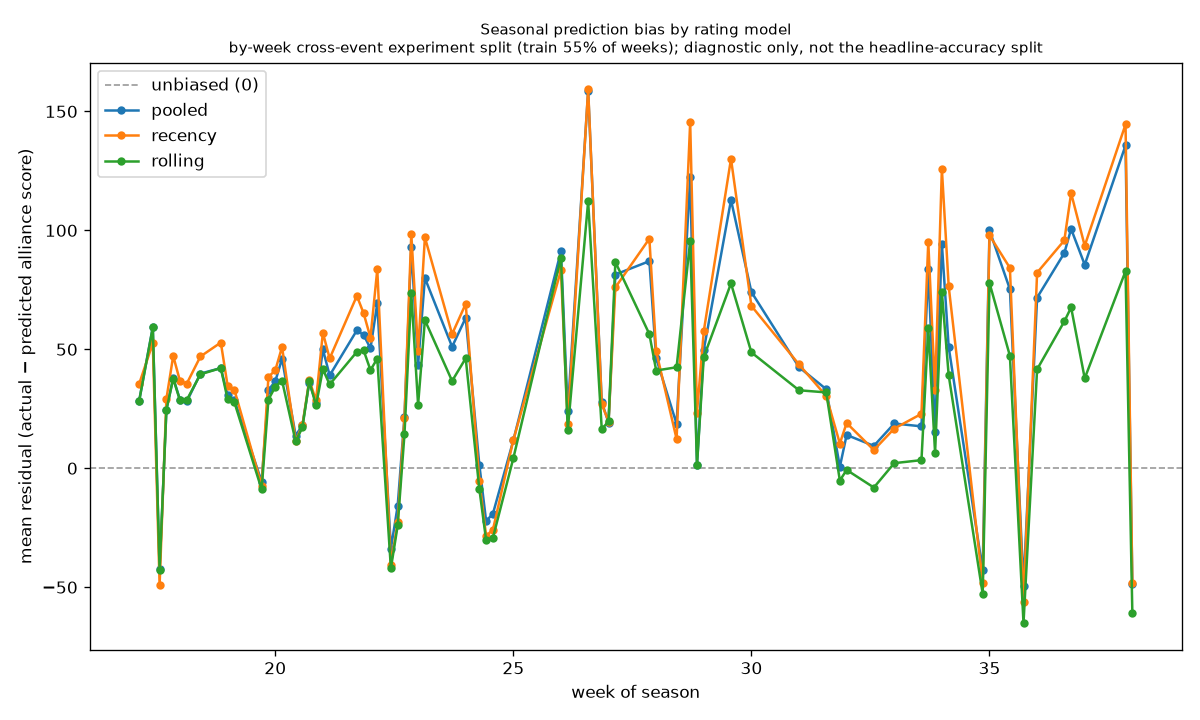
Scores climb all season as teams improve, so a single season-long rating under-predicts late in the year. A "rolling" rating that uses only earlier matches cut that late-season bias roughly in half (about 58 points down to 20). Curiously, just weighting recent matches more by date didn't help — it starves OPR of the match connections it needs to solve.
The takeaway
Tested on a full real season, OPR earns its place — not as a score oracle, but as a quick, surprisingly well-calibrated read on who's strong. Trust it for odds and ranking, distrust extreme values on teams with few matches, and pair it with what your own scouting sees that the math can't: defense, support roles, and whether the points come from auto or endgame. (See our scouting guide.) FTC Tracker shows OPR alongside live rankings so you can read each team's number in context.